
Google Data Studio Series Index
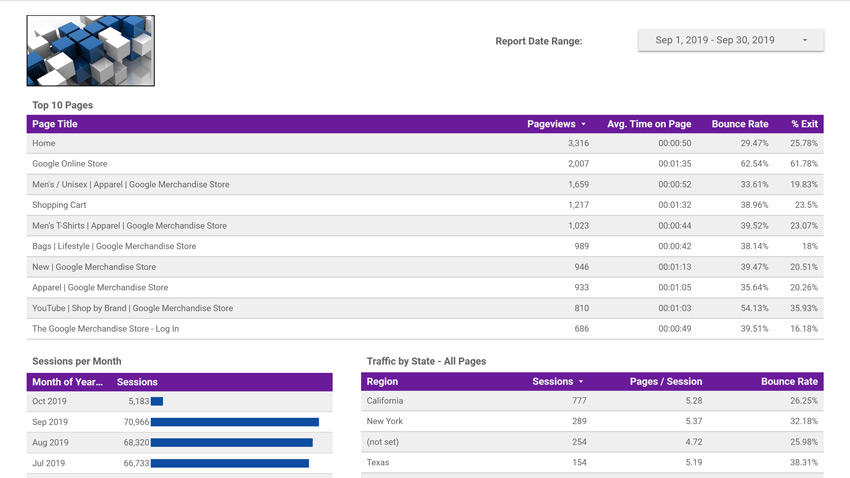
Website owners typically rely on Google Analytics to gain an understanding of how well their websites are performing. However, it’s easy to get overwhelmed with the amount of information available through Google Analytics, and many of the canned reports display the data in a confusing way. These reports are also littered with information that may not be relevant to your business goals.
Here’s some good news. Google provides a wonderful tool called “Data Studio” that makes it easy to visualize data with little effort. While Data Studio is free to use with data from Google Analytics and several other data sources, there are enterprise-level connectors provided by third parties that come with a price tag.
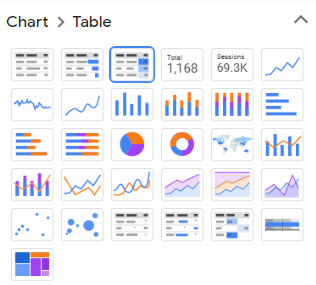 Data Studio offers many features including various chart types to effectively communicate specific data based on the audience’s preference as shown in the image to the right. Once a chart is added to a report, it’s easy to switch to a different chart type without having to start from scratch.
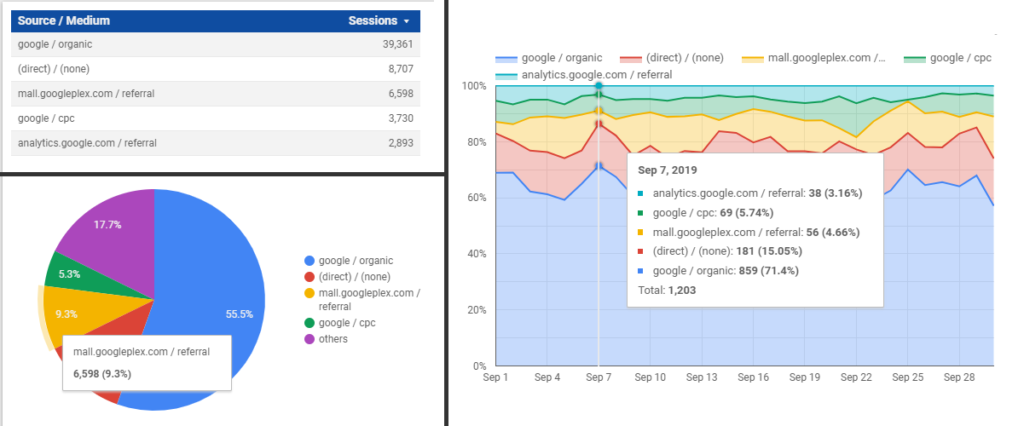
The image below shows the same data displayed in 3 different formats on the same report page from the same data source.
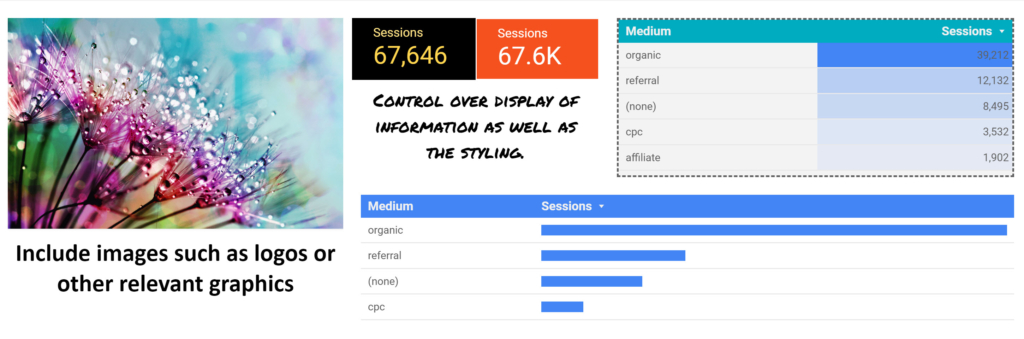
In addition to a variety of charts, Data Studio also provides the ability to add logos, images, and text that can be used for branding, to help deliver a clear message and to highlight important details. Quite a bit of control over the styling is provided as well.
 What’s Next?
This article is the first in a series that is based on my own experience with switching from Google Analytics reports to Google Data Studio. In the next article, I’ll help you get signed up with Google Data Studio and help create your first report. In the meantime, below are a few definitions to help you understand terms that were used in this article.
Terminology
Connector: Connectors are software components that enable communications between your data and Data Studio. Connectors exist for many services such as Google Analytics, Facebook, YouTube and MailChimp. Some connectors are free, while others require a one-time license or subscription purchase.
Data Source: A data source is created by the connector and enables you to select the fields and options through the connector that will be used to create the Data Studio Report. A data source also provides a secure way to share reports and collaborate with other people.
Data Set: A data set is the information that will be displayed in the report. An example of a data set is the information contained in the rows and columns of an Excel spreadsheet.


